METHODOLOGY AND DATA
The Sustainable Development Index is designed to assess the ecological efficiency of nations in delivering human development. It is calculated as the quotient of two figures: (1) a “development index” based on the Human Development Index, calculated as the geometric mean of the life expectancy index, the education index, and a modified income index; and (2) an “ecological impact index” calculated as the extent to which consumption-based CO2 emissions and material footprint exceed per-capita shares of planetary boundaries. For a full description of the SDI methodology and rationale, see Hickel 2020 [PDF]. This page offers an overview of the basic principles.
The SDI formula can be described as follows:

Development Index
The development index follows the base formula of the Human Development Index (HDI), with a sufficiency threshold on income. The formula and its components can be described as follows:
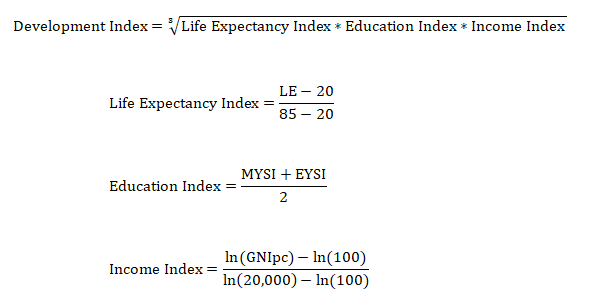
In the education index, the Mean Years of Schooling Index (MYSI) = MYS / 15. The maximum value is 15 years of schooling, which is the projected maximum for 2025. The minimum value is 0 years of schooling.
The Expected Years of Schooling Index (EYSI) = EYS / 18. The maximum value is 18 years of schooling, which is equivalent to achieving a master’s degree in most countries. The minimum value is 0 years of schooling.
The income index here differs from that used in HDI in that it incorporates a sufficiency threshold below the HDI’s maximum value of $75,000 (2017$ PPP). This is because to achieve an income of $75,000 per capita is empirically incompatible with planetary boundaries. Nations with income over $60,000 have an average material footprint of 35t per capita (more than five times over the planetary boundary) and CO2 emissions of 19t per capita (eleven times over the planetary boundary), according to 2019 data. These levels of ecological impact are highly destabilizing and cannot be universalized. In this sense, the HDI income index effectively precludes nations from achieving very high HDI while at the same time remaining ecologically sustainable.
While it is theoretically possible to break the coupling between high GNI and high ecological impact, so that high-income nations can achieve rising GNI while material use and emissions decline down to sustainable levels, extant evidence indicates that it is not empirically feasible to do so, even under highly optimistic policy conditions (see Hickel and Kallis 2019 for a review of relevant literature).
Importantly, high income is not necessary for achieving high levels of human development. While nations with high income generally perform better on key social indicators than nations with lower income, this relationship is not determinate after a certain point. There are several countries with moderate income that nonetheless achieve high levels of life expectancy and education, as well as happiness, employment, sanitation, gender equality, democracy and so on. For instance, according to 2019 data, Costa Rica has a life expectancy that exceeds that of the US with 71% less income per capita ($18,500). Georgia has education levels that match Austria with 74% less income per capita ($14,400).
Such results should be highlighted within any framework of sustainable development: middle-income nations that perform well on key social indicators while staying close to or within planetary boundaries. Given that income is so tightly coupled with ecological impact, it makes sense to look at nations that achieve high levels of human development with moderate levels of income as models to emulate in the process of designing more sustainable approaches to development, rather than punishing such countries for not having high income, as the HDI does.
Of course, income is an important component of human development, in terms of giving people choice, economic agency, empowerment and security. Rather than jettisoning the income index altogether, as some alternative metrics have done, the SDI retains it but incorporates a sufficiency threshold.
According to 2019 data, some nations achieve very high levels (0.8 or above) on the life expectancy index with as little as $3,600 per capita (or 0.9 with as little as $8,600), and very high levels on the education index with as little as $13,200 per capita, while keeping ecological impact at sustainable levels. According to the O’Neill et al. (2018) database of social and ecological indicators, the best performers include nations with as little as $7,000 to $12,000 per capita in 2017 PPP (Hickel 2018). Finally, we know that as GNI exceeds mid-range levels it begins to cause net negative social and ecological consequences (see Kubiszewski et al. 2013; Lamb et al. 2014; Max-Neef 1995; Deaton 2008; Inglehart 1997).
With this range of figures in mind, the SDI sets $20,000 as the sufficiency threshold on the income index scale, at a point above which additional income becomes unnecessary for achieving strong social outcomes. This function creates a curve that crosses 0.8 on the income index at about $7,000, crosses 0.9 at about $12,000, and crosses 0.95 at about $15,000, all of which is possible to achieve without excessive ecological impact. The sufficiency threshold brings the income index in line with the other human development indices (education and life expectancy), in terms of what we know of the relationship between income and social outcomes, while ensuring that countries need not pursue ecologically destructive levels of economic growth in order to score well.
There are a few things to note here. First, countries are not punished for exceeding $20,000; rather, it is simply that income over this level does not further boost a country’s score. Second, this sufficiency threshold does not generate human development scores that differ significantly from HDI (it raises scores by no more than 0.05 over HDI), and does not significantly alter relative rankings (except in the case of nations where HDI is boosted by high income disproportionate to education and longevity, such as Kuwait, whose relative position would decline).
The data for the components of the development index are derived from the United Nations Development Programme, using the same dataset that underlies HDI.
Ecological Impact Index
The ecological impact index can be described as follows:

Average overshoot (AO) is calculated as follows. Material footprint and emissions values are each divided by their respective per capita planetary boundary (which varies by year depending on population size) to determine the extent of boundary overshoot (or undershoot). This also standardizes the units. If the result of either division is less than 1 (undershoot) it is rendered as 1. Then the results are averaged using the geometric mean. This method ensures that a country cannot compensate for overshooting one boundary by undershooting the other. Overshoot of either boundary will yield average overshoot of greater than 1.
The planetary boundaries are calculated as follows. For material use, the sustainable threshold is regarded as about 50 billion tonnes per year (Bringezu et al. 2015). Dividing this by the global population in any given year renders the boundary in per capita terms. For 2022, the boundary is 6.29t per person. For CO2 emissions, we use the IPCC's 2018 SR15 report to estimate the carbon budget for a 67% chance of staying between 1.5C and 2C, and render this budget in per capita terms. For 2022, the boundary is 1.58t per person per year.
In the ecological impact index, AO is indexed on a natural exponential scale. Given the uncertainties around the precise definition of the planetary boundaries, this allows some leeway for small amounts of overshoot. Adding 1 ensures that the minimum result is 1 (no overshoot). For countries that have no overshoot, their development index is therefore unaffected. Once overshoot reaches four times the planetary boundary the ecological impact index registers 2, thus cutting the development index in half. Thereafter a linear function applies. This method ensures that the SDI is an indicator of strong sustainability. Countries cannot use low ecological impact to compensate for poor performance in human development. And strong performance in development cannot compensate for high ecological impact.
Material footprint and CO2 emissions are rendered in consumption-based terms; in other words, they account for international trade by adding the materials and emissions embodied in imports (including the upstream materials and emissions involved in producing and shipping imported goods) and subtracting that which is embodied in exports.
The material footprint indicator measures the total weight of a nation’s material extraction and consumption, including biomass, minerals, fossil fuels and construction materials. Material footprint is a key indicator because material extraction from terrestrial and marine ecosystems has an impact on land-use change, chemical loading, biodiversity loss and other key processes represented in the planetary boundary framework. While material footprint is not a direct indicator of ecological impact, it is a well-established and widely-used proxy in the policy literature and enjoys robust empirical grounding for this purpose (Steinmann et al 2017, Krausmann et al. 2009, p. 2703). Van der Voet et al. (2004) find that while the mass flows of individual materials are not indicative of their ecological impacts, and while impacts vary as technologies change, at an aggregate level there is a high degree of correlation (0.73) between material throughput and ecological impacts.
The data for material footprint is derived from the UN International Resource Panel Global Material Flows database.
The data for consumption-based CO2 emissions is derived from EORA-PRIMAP.
World SDI
There are two methods for calculating world SDI (visible only the time series line chart). Method 1 is to take a population-weighted average of country-level component indicators (i.e., life expectancy, CO2 emissions, etc.) before running them through the SDI formula. This treats the world as if it were a single country. There are two problems with this method, however. First, high-income nations raise the world income index significantly above the population-weighted average of the country-level income indexes, because of how the logarithmic function and sufficiency threshold work, thereby generating a result that is higher than that experienced in reality by the majority of people. Second, the method allows ecological overshoot in high-income nations to be compensated for by undershoot in low-income nations, which is problematic from the perspective of ecological justice. An alternative method (Method 2) is to take a population-weighted average of country-level SDI results. This approach does not permit the overshoot-compensation effect.
Sub-National SDI
Selected sub-national SDI results are marked with an asterisk (*). For Kerala, life expectancy and education figures come from the UNDP’s sub-national data, while GNI per capita (2017 PPPs), material footprint per capita and CO2 emissions per capita are estimated as a ratio of India’s figures. We used the ratio of Kerala’s NSDP per capita (NSDP from here and population from here) to India’s NDP per capita (here and here) in current prices, adjusted for income from remittances (Kerala here and India here). Because consistent remittance time-series data for Kerala is only available to 2019, we have simply extended the 2019 ratio to 2022.
Notes
It is important to note that the approach to ecological overshoot here brackets the principle of longitudinal fair shares. Permissible emissions and material footprint for each year are divided equally among all nations on a per capita basis, regardless of their historical emissions and resource use. In reality, most richer nations have already overshot their per capita fair share of the carbon budget, while most poorer nations have not. Another way to approach this problem is to recognize that the high historical emissions of richer nations have forced the remaining per capita boundary down for everyone else. If we were to account for this, the emissions boundary would be lower for richer nations than what is used here, while for poorer nations it would be higher. Something similar may be said for historical resource use, although it is not as straightforward to calculate as with the carbon budget.
In other words, the SDI understates the overshoot of richer nations and overstates the overshoot of poorer nations. We will attempt to redress this shortcoming in future versions of the index.
Updates
2024 release: Data for life expectancy, education and income runs through 2022. Income is represented in 2017 PPP. Data for material footprint runs through 2022. Data for emissions runs through 2019, and is projected horizontally to 2022.
The CO2 series was cleaned according to the method described in Fanning and Hickel (2023). For some countries, the final years of CO2 and MF data in the series are clear upward outliers. For the CO2 series, in cases where 2019 data was more than double the average of 2013-2015, we projected the 2013-2015 average through to 2022 (this affected two countries: Chad, Lao). For the MF series, in cases where 2022 data was more than triple the average of 2013-2015, we projected the 2013-2015 average through to 2022 (this affected three countries: Lesotho, Panama, Cote d’Ivoire).
It is notable that for many countries life expectancy declined after 2019, during the COVID-19 pandemic, and some countries have not yet recovered their pre-pandemic levels. For example, Costa Rica’s life expectancy in 2022 is three years lower than it was in 2019. This has a substantial impact on the SDI scores.
2021 release: Data for life expectancy, education and income runs through 2019. Income is represented in 2017 PPP. Data for material footprint runs through 2017. Data for emissions runs through 2018, using Eora’s 2021 data release. MF and emissions figures are projected horizontally to 2019 for the final years of missing data. Note that a change in the World Bank’s methodology for estimating Cuba’s PPP income led to a significant downward revision, moving Cuba from 1st place to 5th place in the SDI ranking.
[Download the 2021 release]
2020 release: Data for all indicators is available for 1990-2015. Income is represented in 2011 PPP.
[Download the 2020 release]